IPERF Comparison with JPerf
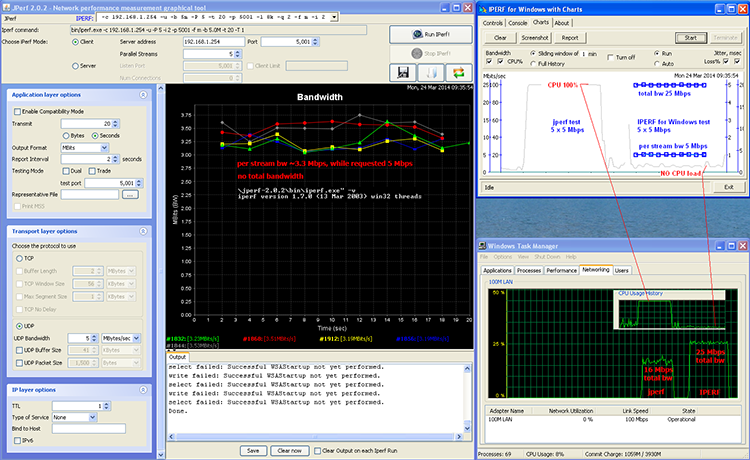
Fresh JPerf 2.0.2 installation from Google Code was used for comparison with IPERF for Windows. There is a confusion right from the beginning: don't think you use iPerf 2.0.2! That's JPerf 2.0.2, which in turn uses iPerf 1.7.0 from year 2003 - please go to /bin folder and check yourself, or click the screenshot below.
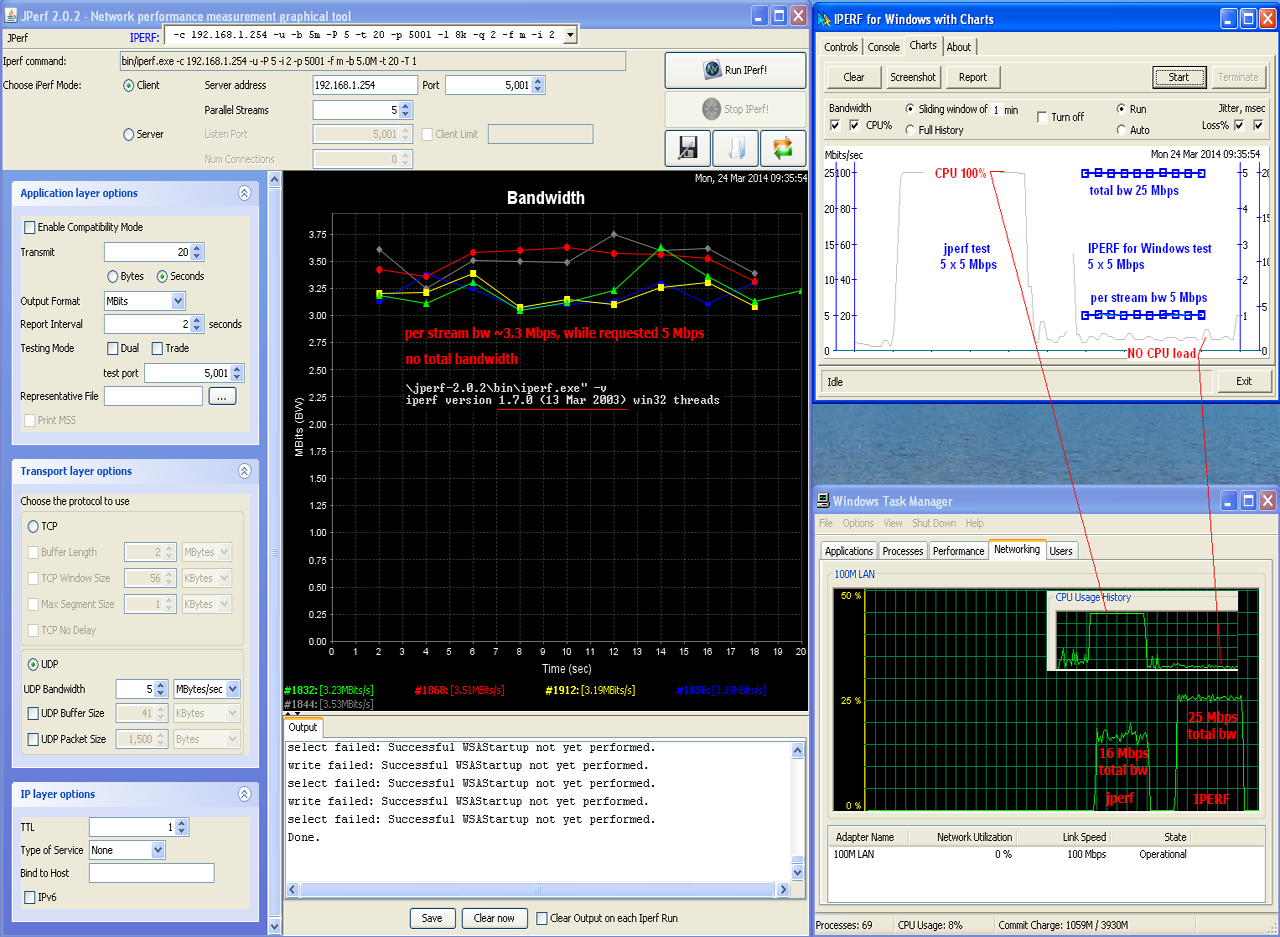
Let's configure moderate traffic: 5 UDP streams of 5 Mbps each, to my default gateway - DSL router, where it will be dropped. Apparently each stream runs only ~3.3 Mbps not 5 Mbps as requested! Run Windows Task Manager as an independent arbiter - it shows total bandwidth of 16 Mbps, not requested 25 Mbps. It shows the problem as well: CPU load goes 100%! Obviously JPerf consumes all CPU cycles so can't run requested 25 Mbps of traffic - what about 1G?
Let's run IPERF for Windows with the same 5 UDP streams of 5 Mbps each. IPERF Charts displays per stream traffic of exactly 5 Mbps, with total traffic 25 Mbps, as requested. Task Manager confirms the same 25 Mbps of total traffic. Also Task Manager and IPERF show, that CPU load is negligible during IPERF test. It gives enough room to run much heavier bandwidth tests. All that was achieved by recent win32 update of original linux iPerf 2.0.5 code and compilation in Visual Studio 2013.
There is no QoS on Windows in JPerf (iPerf 1.7.0 - 'Type of Service'), because Microsoft QoS code is different from linux code.
Comparative results are summarised below and on this screenshot, click it to enlarge:

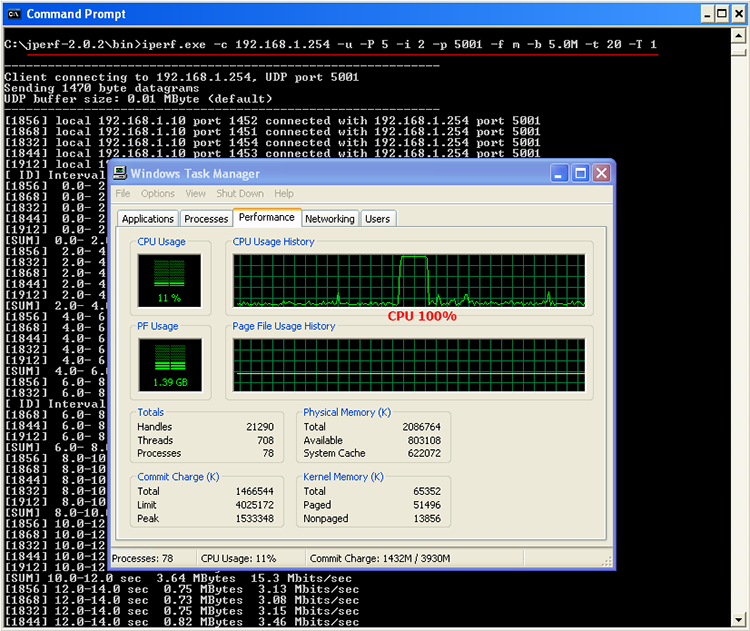
Apparently, high CPU load is produced not by JPerf code itself, but by iPerf 1.7.0. Try to run it without UI in command line with the same parameters - still CPU 100%:

Conclusion:
- JPerf 2.0.2 is unusable in default package, because of high CPU usage by outdated iPerf 1.7.0 from year 2003
- JPerf does not show CPU usage on the same chart like IPERF for Windows does, which is vital for modern high-bandwidth tests
- JPerf User Interface can be used if iperf.exe is replaced with newer binary, for example command-line version of IPERF for Windows (it works!)
- JPerf 'Type of Service' doesn't work the way how QoS shoud work in Windows - DSCP set in IPERF for Windows
- JPerf User Interface has less controls compare to IPERF for Windows, and doesn't have TestHistory drop-down list - which is very handy feature
- JPerf Chart doesn't display total but only per stream values
It can not move charts left and right with a mouse
can not stretch/compress vertical axes with a mouse
does not have Full Time History mode in addition to Sliding Time Window
can not turn On/Off individual charts and axis
can not provide screenshots or HTML reports


